“I want you to panic… I want you to act as you would in a crisis. I want you to act as if our house is on fire. Because it is.” Greta Thunberg, Jan 24, 2019
I have been watching the leaders of my hometown of Bloomington, Indiana claim a concern for climate and equity, create GHG inventories, action plans, and transportation plans, and then go on with business-as-usual, or worse, as if just writing the documents was enough. I’m frightened to find that some of the most progressive cities in the U.S. are behaving similarly, like Portland, Eugene, and Los Angeles.
Let’s be honest, our transportation system in the US is an unjust, unsustainable, inequitable system that must change. It is car-centric, it kills 40,000 people annually, it is most cities’ largest GHG producer, it is a massive burden on the poor, and it wrongly prioritizes cars over transit because the ruling class prefers them.
The right solution is mode shift — increase trips being made by bike, walking, and transit, while reducing car trips. Almost all politicians know this would create a better, safer, and more equitable system, and they are happy to say that they will work to improve these modes, but no one wants to say, document, or actively pursue a necessary piece of this equation — making it harder to drive. That would upset the ruling class that elected and lobbies them.
Bloomington
Bloomington is a “liberal” college town that has a mayor and many council members that repeatedly claim climate and equity concerns. They have a very recent 2018 GHG Inventory (Oct 2019), a 5-year Sustainability Action Plan (2018) but then proceed to create transportation plans, transit plans, and parking plans (subsidized parking garages) like it is 1965, with no GHG concerns or analysis. Their actions, which I detail later in this article, actually exacerbate our unjust, unsustainable, inequitable transportation system.
Inventory
Nationally, GHG emissions have been fairly flat since 1990, with recent reductions in the electric power sector, but counteracted with increases from the transportation sector. Below is a graph of California emissions and targets. The international target of 80% below 1990 emissions by 2050 still stands as the global target. The current transportation emissions alone exceed the 2050 total target for all sectors. This is a heavy lift, and will need immediate and sustained action — as if our house is on fire.

Bloomington’s latest (2018) GHG inventory is not far from these national trends. The transportation sector is the largest GHG sector (in blue) at 27.3%,  and the inventory report admits that the transportation inventory is the most out of control, showing a total growth of VMT (Vehicle Miles Traveled) per capita of 11.5% since 2011.
The report does not show trends, and uses a different, more standardized method for calculating emissions that apparently cannot be compared with previous GHG inventories. It states a 5-year target of 11% below 2016 emissions by 2023, on its way to a 26%-28% below 2005 emissions by 2025 base on their commitment to the Mayors National Climate Action Agenda. This 11% reduction may be a meager goal compared to the commitment, but the report admits not having 2005 or 2016 numbers yet using the new calculation method.
This 11.5% growth in VMT should be a serious red flag that the city’s transportation policies are not working and need some emergency action to turn this trend around. The document outlines some generic transportation policies that would help, but does so without providing any sense of the level of policy change necessary to reverse the trend.
Sustainability Action Plan
Bloomington’s Sustainability Action Plan (Chapter 3 – Transportation) is where the rubber should hit the road. The city has set emissions targets, and the actions need to be substantial enough to meet the targets. Unfortunately, this is where everything starts falling apart.
Transportation is a science. There are formulas and computer models similar to fluid flow or weather forecasting where we can input the conditions, do the math, and determine how people will travel and what routes they will take given the options and the costs, and ultimately calculate mode share, VMT, and emissions. These travel models are GIS systems that look at number of vehicle lanes, posted speed, biking/walking conditions, level of transit services, land-use, neighborhood demographics, parking costs, parking supply, gas prices.
However, Bloomington’s Action Plan does not go near there. It lists some performance targets like % Drive Alone and Transit Ridership that do not appear to be derived through an analysis of emissions targets. For example, the % Drive Alone goal is 60% by 2022, when the 2016 rate was 62.8% and the 2010 rate was 66.3% — a downward trend. If this trend continues – whatever its cause — the math suggests it would be 59.3% in 2022 without changing a single policy. Similarly, the growth in transit ridership goal is 5% total between 2017 and 2023 (~1% annually), when the annual ridership growth between 2002 and 2010 was 8.5% annually. Not ambitious. Unfortunately, Bloomington Transit had its largest ridership decline ever in 2018 at 6%; another red flag that the transportation policies are not working.
In summary, the Action Plan has very weak goals with no math to tie them to the emission goals, and the lists of actions are orders of magnitude below what is necessary to meet these targets. For example, there is no action to increase transit services, only to mildly promote the use of transit.
Transportation Plans & Transit Plans:
In 2019, Bloomington produced both a Transportation Plan and a transit Route Optimization Study. In short, the Transportation Plan shows where new roads will be, and includes some cross-sections based on road classifications that look fairly standard. It DOES NOT INCLUDE TRANSIT. It has no BRTs planned, no transit-only lanes planned. Of its 173 pages, it has 1 page on transit with one paragraph that hints at such ideas. There is no GHG or VMT analysis. These glaring omissions are pointed out in my comments on the draft.
The Route Optimization Study also does not contemplate anything more than taking existing transit resources and using them to improve routes. It contains no BRT, no bus-only lanes, no substantial service expansion. A 2018 article stated, “[Bloomington Transit General Manager Lew] May says a big reason why rider numbers are down is because the city doesn’t have the money to improve current services.” These omissions are noted in my letter to the transit board regarding the draft study.
Also note that transportation plans and transit plans might not be revisited for 4 or 5 years. But our house is burning.
Parking Plans
But here is where everything goes very wrong. This is where the flock of red herrings are uncovered, and the local government ruling class is exposed along with how entrenched the administration and Council members are with them.
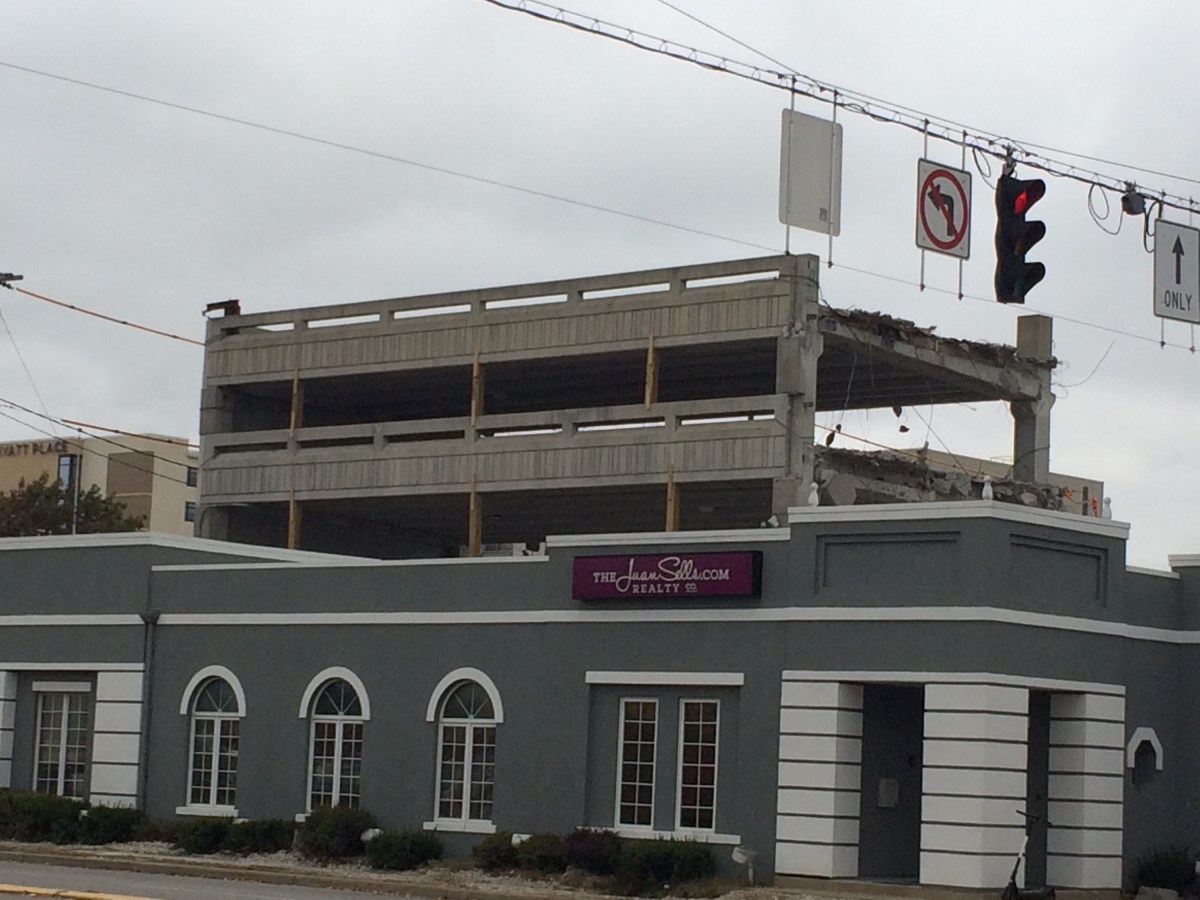
In the midst of all this climate and equity concern, the Council and the administration approved the construction of one new 379-space parking garage downtown to stimulate development, and another replacement garage that adds 200 more spaces, both paid for with TIF funds to the tune of $29 million total.

Why? Because developers say they will not build unless the city builds them parking (garage#1). And, because when the existing garage (garage#2) was found unsafe, the large employers using it threatened to leave downtown, so the city promised them an even larger new one.
The ruling-class wins again. Nothing has changed. You should no longer wonder why the transportation policies are not working.
Cities that are seeing transit growth — like Columbus, OH — are doing THE VERY OPPOSITE. They are investing in transit, and not increasing the supply of parking. And, they are investing heavily in TDM. I give Bloomington a D- for their current TDM efforts. Governing Magazine Editor Alan Ehrenhalt once summed up his research; “Ironically, the central city districts that have thrived in recent years aren’t the ones that have provided the most parking; they are the ones that have provided the least.”
TIF (Tax Increment Financing)
To add insult to injury, the use of TIF funds is a double-whammy. TIF becomes regressive after success, and that’s exactly where this downtown TIF district is. The downtown was hurting decades ago and TIF funding was absolutely appropriate, but now the downtown is booming. TIF money is tax revenue that would otherwise go to the school district and other public services, but this money is going to build parking so high-end developers don’t have to, and so downtown’s high-end employers and their suburban employees have cheap and convenient parking, and don’t have to consider other modes. Could this be more inequitable? Could we do better at taking from the poor (schools), and giving to the Haves?
This TIF money could be used on transit infrastructure. BRT costs $3-$7M per mile, and the TIF district is the perfect crossroads for a N/S and E/W BRT. This is a win-win for everyone, even the developers and employers. But, these transit concepts are not in any plan, so … oh, well… let’s use it for some parking garages.
This decision will exacerbate VMT, GHG emissions, inequity, and transportation injustice. It was made with no consideration or analysis regarding the effects on GHG emission or equity, nor any consideration of the long-term parking needs as we move toward TNCs (Uber, Lyft, etc.) and AVs (Autonomous Vehicles). They are throwing fuel on the fire while claiming it’s water.
In Conclusion:
It is time to make sure every dollar spent and every project planned includes an analysis of its GHG effects and equity effects, and make sure we are maximizing our reductions/$ and our reductions/day. It is time that politicians realize that transportation is a science that is complex and often counter intuitive, but that mode choice and transportation equity is in their hands.
I have only heard one incumbent politician say it succinctly and boldly: “Cars are the problem, elected officials have control, let’s exchange car lanes for transit-only lanes.” Mayor Meghan Sahli-Well, Culver City, CA. April 2019, SCAG Conference.
If your community does not have goals like cutting the current SOV mode share in half, ubiquitous road diets, transit-only lanes on existing pavement, and major shifts in funding to transit operations, then your community hasn’t done the math. If parking garages and road widenings are still in their plans, they need to redo their plans with a travel model that is sophisticated enough to determine mode share and VMT. Bloomington needs to cancel those garages and restart their plans with a climate and equity lens and a calculator.
Portland is making the same mistake with regard to highway widening. Eugene and Los Angeles are also failing to connect the dots, although they are closer than Bloomington. More on this in the next blog.

2 thoughts on “Bad Transportation Planning in a Time of Crisis – Bloomington, IN.”
Comments are closed.