Portland has been a leader in the discipline of Planning for decades, and still is, but the disconnect is between Planning, Engineering, and the Deciders, and it’s systemic. We cannot get to where we want until the system is fixed, and PBOT now has the right leader to do it, Commissioner Hardesty.
In February 2021, PBOT (Portland Bureau of Transportation) had the chance to set the new paradigm for street space allocation, and it failed miserably. Epically. This project could have been a model example locally and nationally, but instead PBOT continued its decade-long trend of car-oriented decisions.
While Portland has plans to aggressively reduce transportation-induced GHGs and traffic violence, they are increasing because good Plans do not trickle down to the Deciders, and those people are car-centric.
To cause the mode shift necessary to meet the GHG and Vision Zero targets, paradigm shifts in pavement reallocation to other modes is necessary. The mode shifts necessary are explicitly described in the 2015 Climate Action Plan, and mode priorities are explicitly described in the Transportation System Plan (TSP), and these were ignored and left out of the decision criteria for The Hawthorne Decision.
The Deciders chose Alternative 2, which will result in no mode shift and no change in safety. Choosing Alternative 3 would have initiated a serious road space reallocation, optimized bike access, maximized safety, and had a seriously positive effect on the street environment, business, and ultimately on Portland’s future. The Hawthorne Decision is on the wrong side of justice.
The Hawthorne Decision – History
The Hawthorne Decision began when PBOT had a maintenance project to repave Hawthorne and decided the four 9-ft lane configuration could be redesigned and repainted to better meet community goals. That’s a considerable effort from the standard repavement project. PBOT created some alternative designs that included:
- Alt 1: No change: four 9-ft general-purpose lanes.
- Alt 2: Road diet: three 12-ft lanes (2 thru-lanes, center turn lane), no bike lanes
- Alt 3: Reallocation: 2-lanes with bike lanes: (3A) buffered, (3B) protected.
After some public outreach where PBOT did a public survey with less than 1000 respondents, and a petition for bike lanes was submitted with over 2500 signatures, PBOT chose Alternative 2 – dedicating the entire roadway to vehicular traffic with no bike lanes at all. PBOT’s Hawthorne Final Decision Report and other published documents provide reasoning that I will summarizes to transit speeds and emergency vehicle access.
As a Transportation Planner for the last 20 years, and a travel demand modeler for 5 of those years, the red flags in these documents overwhelmingly expose the systemic pro-car bias that exists and will continue to exist until the system is fixed.
Systemic Car-ism
Traffic engineers are trained to move cars and to expect more cars; their guidance documents and performance measures are to move cars and expect more cars; their models show eternal car growth, and they are only provided tools to prepare for and perpetuate that growth. This is the product of decades of systemic bias, a system that perpetuates the mode of the ruling class. We need to flip this on its head.
Meanwhile, politicians and/or ladder-climbing administrators (the Deciders) have no obligation to follow Plans, so they follow the political winds. This is where Planning, Engineering and the Deciders have such a disconnect and a systemic change is needed.
Portland’s Climate and Transportation Planners have done the math and have announced the need for a massive mode shift in the next 10 years, while the Engineers who have been given license over the streets continue to find new excuses to move cars.
In my tenure as a Transportation Planner for other cities and states, I have seen the “need” to add car capacity morph from “relieve congestion”, to “reduce idling”, “reduce freight delays”, “improve economic efficiency”, “reduce rearend collisions”, and now to “improve transit speeds” and “emergency vehicle access”. To keep selling this, they employ biased surveys, driver-majority sentiment, fear tactics, false claims, distorted dimensions – all of which exist in the Hawthorne Final Decision document. This is business-as-usual to placate the travel mode of the ruling class – driving.
Although this project is not a road widening, the Deciders have chosen the Alternative that is the most beneficial to drivers by dedicating the entire roadway to vehicles, bringing all the lane widths up to highway standards (12 ft), keeping all the parking, making sure the Level-Of-Service (LOS) and vehicle capacity for cars is maximized, keeping the road hostile to bikes, and avoiding anything that might perceptively impede police or fire access.
If you’re wondering why GHG emissions, VMT, and pedestrian deaths continues to climb in spite of plans for the opposite, it’s because we’re doing the same thing that got us into this situation.
Business-as-Usual or Paradigm Shift?
One of so many red flags in The Hawthorne Decision Report is the criteria for choosing the best alternative has no Vision Zero or GHG goals like (1) a mode shift, (2) reduced VMT, or (3) prioritizing walking, biking, and transit, over cars.
From a professional transportation planner, this decision for Alternative 2 instead of Alternative 3 is a massive missed opportunity that will perpetuate the car-oriented system. Alternatives 2 will increase speeds and maintain VMT, and do nothing for cyclists, pedestrians, or transit speeds.
Alternative 3, however, would have reallocated road space to bikes, limited car capacity and car speeds (no center turn lane), maximized safety because roads with bike lanes are safer for all users, reduced sidewalk use for biking, improved the street pleasantness and calmness for all, improved ped safety with more buffer, slower cars and shortened cross distances (2 lanes), reduced the demand for parking, improved access to businesses by walkers and bikers, brought more people and prosperity to businesses, proven that traffic diversion is not real when cycling is enhanced, cost a fraction of a normal road reconstruction, and set the stage for similar treatments throughout the city and nation.
This would have been a model project because not only would it have reversed a systemic paradigm and improved the area in every way, but it would have happened quickly on a maintenance budget with just paint.
“Road space reallocation seemed to ignite behavior changes and break habits of private car usage that may not have been broken otherwise.”

Dario Hadalgo, Bogota Transport Engineer.
At the time, early in Commissioner Hardesty’s tenure with PBOT, she may have felt she had little choice but to put her trust in her technical experts and their administrators who support this decision.
Zach Katz was leading the on-the-ground effort to make Hawthorne bike friendly via HealthierHawthrone.com. He started a GoFundMe campaign on April 6, 2021 to begin a legal battle. And BikeLoud has taken it up according to this article per a November 18, 2022 lawsuit! Please continue to donate.
The Ignored Plans: 2015 Climate Action Plan and TSP
This following is the technical information of Portland’s history and Plans and data to establish the above points as fact.
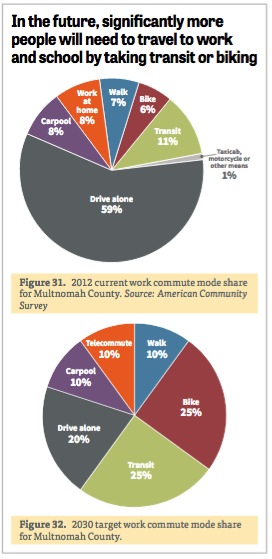
Portland’s 2015 Climate Action Plan says to meet the city’s 2030 climate goals, the percentage of commute trips need to go from 59% drive-alone trips to 20%, and all trips from 78% drive-alone to 40% (p. 48). That’s just 10 years from now.
This is an unprecedented 4% mode shift per year. That’s massive. Later in this document, I show that the city’s most recent 4% mode shift effort required 8 year of infrastructure changes — from 2000 to 2008. A 4% mode shift per year is 8 times faster and requires all hands on deck for all alternative modes.
The 2015 Climate Action Plan also states that the city’s Transportation System Plan (TSP) must model and reflect these same mode-shift goals (Actions 4H, 4L, 4M and 4N).
The TSP is a required municipal document that lists what policies and projects the city will do to meet state, regional, and municipal transportation goals over the next 20 years. The TSP, which was updated in March 2020, fails in more ways than they admit, and will not come close to meeting the Climate Action goals.
The 2020 Climate Progress Report states, “While emissions are down in other sectors, the reverse is true for transportation. Transportation sector emissions have climbed over their low in 2012, and are now 6% above 1990 levels. Transportation now makes up over 43% of total carbon emissions in Multnomah County, with emissions growing nearly twice as fast as population growth over the past six years.”
Transportation System Plan (TSP)
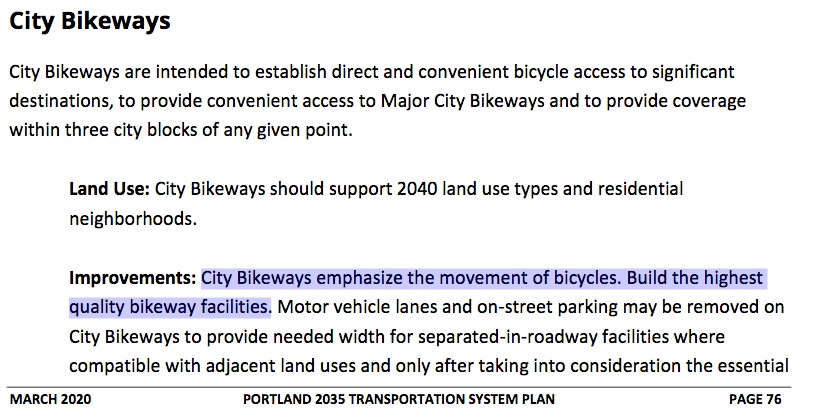
Although the TSP has many shortfalls that fail to get us to the GHG and Vision Zero goals, The TSP does state policies and plans that demand Alternative 3, and require rejecting Alternative 2. The TSP lists Hawthorne as a “City Bikeway” which is a street that will “emphasize the movement of bicycles. Build the highest quality bikeway facility.”
The TSP also describes the mode-priority pyramid to be used on Portland streets. This means when allocation road space, you make room for walkers, then bikers, then transit, then if there’s space, or sharable space, then make room for cars. Alternative 3 does this, and Alternative 2 fails to do this. These documents are formally adopted by the City Council. This gives them legal meaning, and they are being violated.

Planning documents, however, are treated like policy documents – they are commonly ignored. Often, they are created with the best of intentions by planners who are trying to level the playing field and create an awesome place to live that works for everyone. However, sometimes they are feel-good documents created to appease an advocacy group and make them feel heard in hopes to chill or eliminate their testimony at public meetings. Either way, without the explicit force of law, when the rubber hits the road, plans do not have the force of law and the powers-that-be can do what they want.
Alternative 3 and Portland’s Historic Mode Shift
While Portland has a well documented history of discriminatory land-use and transportation planning practices, Portland was also one of the first cities to kill highway plans (albeit through a white neighborhood), expand mass transit, build light rail and bike infrastructure, and create an Urban Growth Boundary, all of which helped make Portland one of the more livable and car-independent cities in the nation.
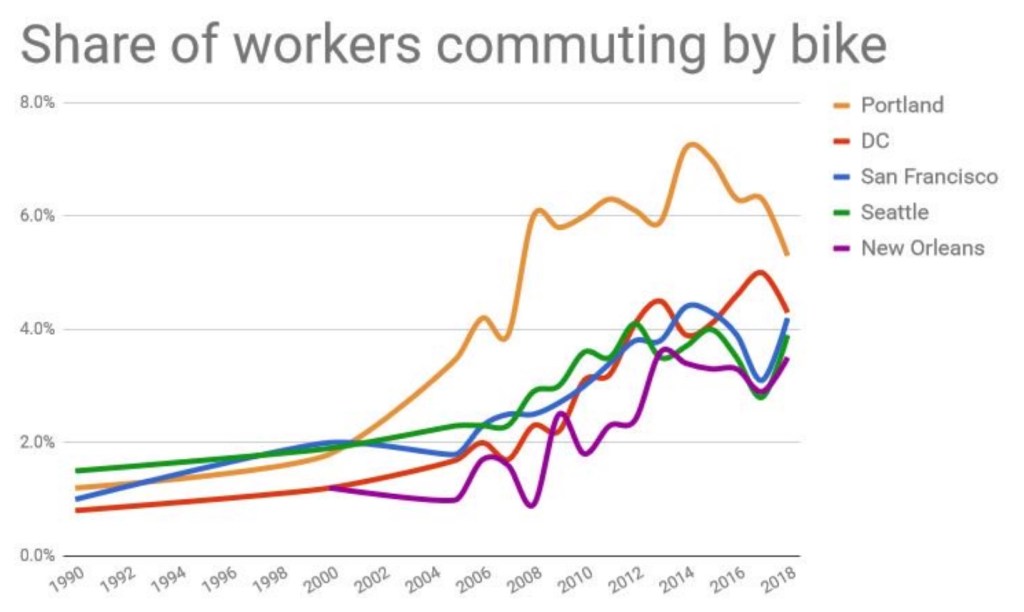
In the 90s, thanks much to a bike lobby, PBOT started focusing on moving people by bike. The graph below shows two decades of effort that quadrupled the miles of bike infrastructure while octupling bike ridership.

This had the not-so-surprising result of creating a substantial mode shift; one that not only made Portland the 2nd “Platinum” Bike-Friendly City in the nation, but also substantially separated Portland’s per capita Vehicle Miles Traveled (VMT) from the national trend it had previously been following.
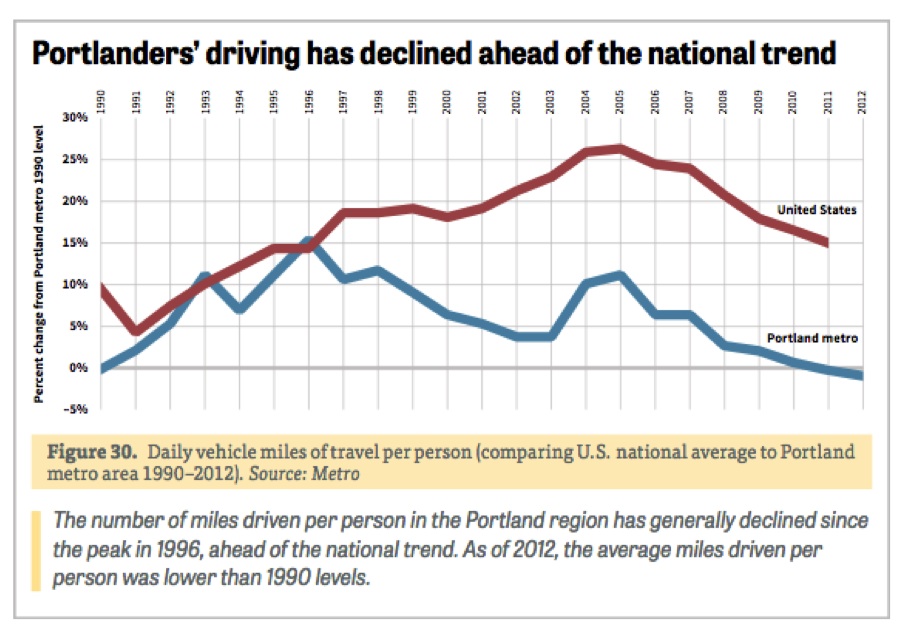
These bold actions by Portland leaders and PBOT planners and engineers were ahead of their time and reached beyond the existing guidelines on bike and traffic-calming treatment, and many are now mainstream and have been incorporated into national engineering guidelines. However, that boldness has flattened over the last decade as is evidenced in the graph below. Note that this represents a 5% mode shift over nearly two decades, although 4% of that occurred over an 8-year period.
In 2008, the city estimated the total cost of the bike infrastructure that brought this 5% mode shift at $60 million. Ten times this is less than the cost of the Rose Quarter project, a project which will induce more VMT and crashes.
Post-COVID Mode Shifts?
Since the Climate Action Plan was adopted in 2015, mode shifts were not happening. This is because TSPs were not, and still aren’t, designed to solve this issue. During COVID, mode shifts have included enormous drops in carpooling and transit with concomitant rises in teleworking, and record high bike and ebike sales. Unfortunately, car ownership is up as well, and VMT is returning to pre-COVID numbers.
Thus, to get to an unprecedented 4% mode shift per year, biking is paramount. It’s the logical, low-hanging fruit.
Hawthorne Traffic Volumes – Same as Belmont and Division
It is important to note that engineers, as a rule, are very “standards” aware. 9-ft lanes, which Hawthorne has had for decades, is an minumum/outlier in the guidelines, and 12-ft is considered “the standard” lane width. Also, after decades of road diets from 4 to 3 lanes throughout the nation, the evidence is clear that 3-lane roads can carry substantial traffic — between 15,000 to 20,000 ADT (Average Daily Travel).
Meanwhile, 2-lane roads without turn lanes have less capacity and flow reliability, especially with frequent buses and bus stops. As such, although PBOT’s documents temper this as a reason for their decision — this is the reason for their decision! This relieves them of the liability of 9-ft lanes, maintains current levels-of-service to cars, and will allow for continued growth of traffic.
After 5 year as a travel modeler, I find the following statements are PBOT’s most intentionally deceptive:
The Feb 2021 Decision Report states, “Alternative 3 would reduce Hawthorne from four lanes to two lanes with bike lanes. PBOT does not have experience with this type of lane reduction….”
September 2020 BAC Meeting Staff Response: “Belmont and Division have lower traffic volumes, and also are used less by drivers as a way to access Cesar Chavez. So from a traffic perspective these are not comparable streets. Our TSP also classifies Hawthorne as a District Collector, whereas Belmont and Division are Neighborhood Collectors. So Hawthorne is meant to serve longer automobile trips according to adopted policy.” (Answer to 9.)
“No, we assumed a 25% volume reduction on Hawthorne, based on an optimistic reading of the travel demand model. Even with a 25% reduction in traffic, there is a predicted 8 minutes of added travel time, mainly due to the reduction in capacity at Cesar Chavez. (Answer to 9a.)
In fact, Portland has two streets that are perfect models for how well Hawthorne can function with Alternative 3. Division and Belmont both have a 2-lane configuration with 35-ft curb-to-curb width and 42-ft, respectively, as compared to Hawthorne’s 52-ft width. Yes, the 40-ft neckdowns at specific intersections will require the loss of bike lane buffers, but should allow for continued 5-ft unbuffered bike lanes, which is within NACTO specifications.
In 2019, the City did traffic counts at the 3700 block of both Hawthorne and Division. These are 48-hour midweek studies. The ADT on Hawthorne was 15,730 cars/day and 12,362 car/day for Division, a 20% difference. Bus 14 services Hawthorne with 15-minute frequency, while Bus 2 services Division twice as often. Belmont is likely to have a closer traffic count to Hawthorne, but no traffic counts were found. Both Belmont and Division streets function well for pedestrians and buses, but they unfortunately don’t have the space for bike lanes. Hawthorne does.
If PBOT assumed a 25% drop in volume on Hawthorne as they say, we know exactly how Hawthorne will work — just like Division. Any claim of significant delays at Hawthorne and Cesar Chevez are, again, a flaw of their model that assumes no mode shift or rerouting; it’s not real.
Chicago’s City Engineer, John LaPlante, said for safe and Complete Streets, city streets should be design no higher than a Level Of Service D (~90% of peak capacity), and that any higher LOS is under-utilizing pavement, encouraging speeding, and inviting unwanted future vehicular-traffic growth onto walkable, bikeable main streets.
This concept of a maximum LOS rather than a minimum is a necessary change in the paradigm; it is a statement that suggests that if more people are going to need the roadway, they will need to find a mode other than driving alone, like bicycling.
Alternative 3 and Transit – Same as Alternative 2.
Transit has been deemed a significant aspect of this decision and the Decision Report claims that speeds are improved with Alternative 2 and thus equity is improved. However, PBOT provides a different intersection treatment at Cesar Chavez for Alternative 3 that creates (in a model) a serious delay for all vehicles, including transit. PBOT admits in their Sep 8, 2020 response to Bike Advisory Committee they could put the same treatment for Alternative 3 and get the same results, but this is not quantified in the final report.
The Decision Report makes no claim any Alternative actually causes a mode shift, because it doesn’t. Mode shift between transit to driving is not affected by speed unless the transit speed is changes relative to driving. In this case, since the bus and drivers share a lane, there is negligible shift of transit speed and thus mode share. However, if there are bike lanes, people may shift to bicycling as it will be notably safer and efficient relative to was there.
Why Alternative 3 Is The Right Choice
Here is the drawing presented to the public for Alternative 3B.

Hawthorne has numerous bumpout that maintain a pavement width of 40 ft. This drawing gives the impression that Alternative 3 eliminates the potential for a left-turn lane or transit-only lane. In fact, the width can handle three 10-ft lanes and two 5-ft bike lanes. The 3rd lane could be a left-turn lane to satisfy our Deciders’ concerns for traffic movement, or it could be a transit-only lane if they would like to advance transit speeds with queue jumping options.
Alternative 3B could eliminate conflicts with bike lanes by moving the bus stop from the bumpout to the hatched-off parking space behind the bus (see drawing). This would also eliminate the bus needing to weave back into traffic, and it would improve the visibility of cyclists at the intersection.
Alternative 3 and Safety
The Hawthorne Decision of Alternative 2 changes the lane widths by 3 ft, from 9-ft to 12-ft, although some of PBOT’s drawings deceptively showed them as 11-ft by changing the parking lane to 9 ft (from 8 ft). NACTO Urban Street Design Guide provides multiple statements and references to evidence that “Wider travel lanes are correlated with higher vehicle speeds.” Their graphic specifically mentions, “when lanes widths are 1 meter (3.3 ft) greater, speeds are predicted to be 15 km/hr (9.4 mph) faster.” Thus, this data indicates a 9 mph increase in speeds due to the change in lane widths.
To my dismay, as often as I would expect PBOT staff to use and reference NACTO in all their work, the Decision Report says, “Both Alternatives 2 and 3 are expected to reduce speeding.” However, Alternative 2 will have wider lanes than Alternative 3 and a center turn lane, both of these treatments result in increased speeds. Thus, Alternative 2 WILL HAVE higher speeds than Alternative 3 based only on lane configuration.
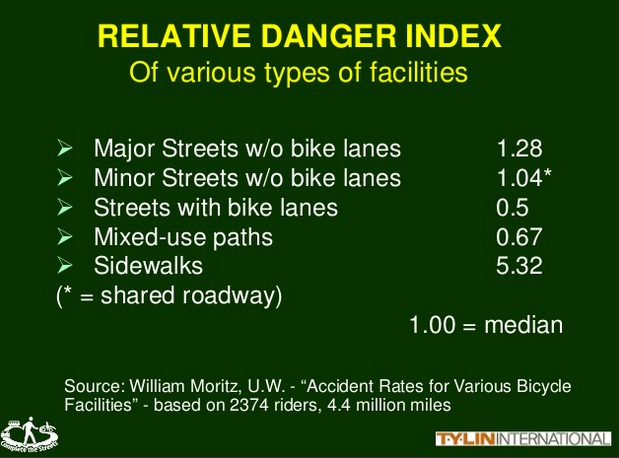
There is also evidence that streets are safer with bike lanes. Mr. LaPlante provided evidence that cyclists riding on streets with bike lanes have a lower danger index (risk of a crash) than riding on streets without bike lanes. (See slide below).
It fails logic and integrity for PBOT to choose an Alternative that all evidence suggests will have higher speeds, provide us data that shows failing speed compliance on the corridor, and then offer a counter solution of lowering the speed limit from 25mph to 20mph as if that might work. It is not working now. This is more red flags and failed logic and evidence of the disingenuous decision being perpetrated.
Along with this is the promise of pedestrian Islands that will come after more study and when funding becomes available. I promise you, they will only occur where left-turns cannot be made and they are very unwanted by emergency services. These are a very unlikely promise, and to the extent they do happen, they will eliminate the potential for Alternative 3 to ever replace Alternative 2.
Emergency Services Authority
Although we currently think of police power abuses in terms of brutality, racial profiling, and a lack of accountability, the level of power the emergency service agencies are given in transportation is profound. In my days as a Transportation Planner, the police or the fire departments restricted speed humps and lane narrowing, disallowed bumpout and reduced curb radii, and limited on-street parking. They also killed a Cyclovia event by determining an excessive need for police and overtime pay, and required a road to encircle an entire grade school for fire access. The power of Emergency Services were a pervasive intrusion in our ability to make any changes to improve safety!
To think that the organizations that exist to protect the public are a hindrance to designing streets that protect the public is disconcerting. And while we have data that proves the traffic violence our transportation system causes, I have not seen data on how many deaths occur because emergency vehicles were slowed by traffic calming.
My guess is they are orders of magnitude from each other, although the emergency services always won the day… and they were coincidentally aligned with the goals of engineers who made all the final decisions.
Equity
Equity is a complex issue in transportation. I see inequities in my profession and try to expose them. That’s what my blog is about. Bike lanes have been considered a product or foreshadowing of gentrification, which is often a threat to disadvantaged communities. Biking and walking while black have a history that does not endear bike lanes to BIPOC.
Theoretically, bicycling is a far more economically beneficial way to get around, and does level the transportation playing field as more and more people use it, but there needs to be safe routes, police fairness, and the decisions need to be based on and made by those who have been disadvantaged by historic power imbalances toward the mode and geography of the ruling class. Continuing to build for the car because it is currently the only way to get around efficiently is NOT the answer; we must build less destructive reasonable ways, and the bicycle is a valuable solution.
CONCLUSION: Alternative 3 or Bust
PBOT is failing on the GHG front, the VMT front, and the Vision Zero front, and the decision to use Alternative 2 shows the failing will continue, and that PBOT has some bad apples that are spoiling the potential to get anywhere on these issues.
Here is a road map for success:
- Study the speeds and crash data since doing Alternative 2.
- Promote and/or hire bold PBOT leaders and engineers.
- Complete a new TSP that meets all the Climate Action Plans (Objective 4).
- Update the travel model to calculate mode shift and modify TSP to meet goals.
- Focus Scenarios on road space reallocation to bikes and transit.
- Simple street treatments: paint, calming, and movable barriers and planters.
- Take immediate and fast action on other streets as if our house is on fire, because it is.
